
Características Antropométricas y la Ingesta Dietética de los Jugadores de la División de Honor y División de Honor B de un Club de Rugby Español
Anthropometric Characteristics and the Dietary Intake of Players of the Honor Division and Honor Division B of A Spanish Rugby Club
Maria Fernanda Gayol Flores1 y Manuel Sillero Quintana2
1Universidad Europea de Madrid. Escuela del Real Madrid
2Facultad de Ciencias de la Actividad Física y el Deporte. Universidad Politécnica de Madrid
Artículo publicado en el journal Kronos, Volumen 18, Número 1 del año 2019.
Publicado 19 de junio de 2019
Resumen
Palabras clave: Profesional, élite, rugby profesional, rugby de élite, nivel de jugador, posición de juego
Abstract
Keywords: Professional, elite, professional rugby, elite rugby, player´s level, playing position
INTRODUCTION
Rugby is a contact team sport that is characterized by high-intensity interval training (Heffernan et al., 2016; Sedeaud et al., 2012). There are passive and active periods like running, speeding, tackle, and collision and also low-intensity aerobic periods and rest (Carling, Lacome, Flanagan, O’Doherty, & Piscione, 2017; Cunningham et al., 2016; Jones et al., 2015). The total distance covered in a match can go from 4000 to 8000m, this depends on the position, and it can go up to 1000m in high-speed distances (Till, Scantlebury, & Jones, 2017).
A Rugby Union (RU) match last 80 minutes divided in two halves (Suarez Moreno-Arrones, Portillo, & J.M., 2014), the RU team consists of 15 players that have different playing position and are divided into two main groups: “Forwards” including loose-head prop, hooker, thigh-head prop, locks, blind-side flanker, open-side flanker and number 8 and “Backs” including scrum half, fly half, left wing, inside center, outside center, right wing, and full back (Heffernan et al., 2016). Previous articles have observed differences in aerobic capacity and motor activity depending on the playing position, including the linear speed, agility in the change of position, muscular strength, and muscular power (Carling et al., 2017; Heffernan et al., 2016). Backs cover a more significant portion of the field by passing plays, longer sprints, and maintaining the clack line (Gamazo, 2014). As a consequence, Backs are expected to display greater endurance capacity (Nakamura, Pereira, Moraes, & Kobal, 2017), and because of that, they spent 58% of the time running while Forwards only spent 13%. Male competition in Spain is divided into three national categories: Honor Division, Honor Division B and First National, described by the highest category order.
Given the physical contact nature of the game, the physical characteristics are considered important for performance, which is why significant differences in height, weight, and composition of the body mass have been observed depending on the playing position (Gabbett, 2006; Till, Tester, et al., 2017). Higher values of weight, height, and skinfolds have been observed in Forwards. These anthropometrical characteristics have been suggested to provide a protective role for tackles and collisions, while Backs have shown smaller body size that facilitates speed and high-intensity activities. Da Cruz-Ferreira & Ribeiro (2013) studied a group of Portuguese Rugby players and reported that Forwards were on average, heavier (96.1 vs. 86.9 kg) and taller (1.80 vs. 1.75 m) than Backs. The mean of the sum of the nine skinfolds was equally significantly lower for the Backs (129.1 vs. 189.9 mm) than for Forwards, which is going to interpret as a fat mass percentage of 15.7% (±5.10) and 21.2% (±7.69) respectively. In another study in which they observed the anthropometric characteristics during five years, it was reported that the sum of seven skinfolds was higher for Forwards than Backs (84 vs. 60mm) (Duthie, Pyne, Hopkins, Livingstone, & Hooper, 2006).
The daily nutritional intake of any athlete should meet the energy, macronutrients and micronutrients requirements to have the fuel for training at high-intensity, to promote optimal recovery after a competition, and for the general health and wellbeing of the athlete. Given that there is no gold standard tool to assess energy intake, the choice of method depends on the population to measure (Bradley, Cavanagh, Douglas, Donovan, Twist, et al., 2015). Twenty-four-hour recall is easy to administer and does not require too much time, so this won´t be a burden to the subject. Being a retrospective method, the subject´s usual intake is not altered, and they are a useful tool when working with professional players (Castell, Serra-Majem, & Ribas-Barba, 2015). They have also shown to be useful in measuring the energy intake of a team, given that increasing the number of subjects measured decreases the variability and that simple methods for assessing a group mean dietary intake is more accurate then weighted dietary intakes (Sawaya et al., 1996).
While the carbohydrate recommendation of energy should be 6 – 10 g/kg (Burke, Hawley, Wong, & Jeukendrup, 2011), in recent years, many Rugby players have adopted a lower intake of CHO to maintain or reduce the body fat. The low intake of CHO during training and competition could affect the amount of blood glucose and hepatic glycogen. Bradley et al. (2015) reported that Forwards and Backs had a lower CHO consumption than recommended (3.30 ±0.70 and 4.10 ±0.40 g/kg, respectively). To promote muscle protein synthesis and to diminish muscle protein breakdown, it is essential to consume an adequate intake of protein. Daily protein recommendations for individuals in resistance training exercise lean towards a range of 1.2 – 2.0 g/kg/day. Evidence suggests that many Rugby athletes consume protein above the recommendations up to 2.7 g/kg/day (Bradley, Cavanagh, Douglas, Donovan, Morton, et al., 2015; MacKenzie-Shalders, Byrne, Slater, & King, 2015; MacKenzie-Shalders, King, Byrne, & Slater, 2016).
Rugby Union players usually train 3 to 5 days a week and some of them play in one 80-minute competitive match per week. To complete the nutritional requirements, it is essential to understand the total energy expenditure. Some studies have attempted to quantify the energy expenditure in Rugby players, but due to the characteristics of the game, there are some limitations. Bradley et al. (2015) used the SenseWear Pro2 technology to assess the energy expenditure of the players, determining that the energy expenditure is 3343 – 3821 kcal a day. In another study published by (Zanetti, Pumpa, W, & Pyner, 2014) estimated using the SenseWear an energy expenditure of 1.10 kcal∙min-1 during exercise and 0.8 kcal∙min-1 post-exercise. Using the gold standard Doubly Labeled Water technique, food diaries and Resting Metabolic Rate (RMR) (Morehen et al., 2016) suggested an energy expenditure of 5374 kcal a day for the Rugby player. The most used prediction equations validated in athletic populations to estimate RMR (Cunningham et al., 2016) considering that the specific energy expenditure of the activity for Rugby and other similar sports corresponds to an intensity of 6.30 METS for non-competitive and 8.30 METS for competitive practice (Ainsworth et al., 2011).
To our awareness, comparisons between playing position and the competition category are still lacking. In addition, to date, no studies are comparing the nutritional intake in between position and the correlation of the diet and body composition. Therefore, the aims of this research are 1) to associate the anthropometrical characteristics of Rugby Union players in Spain according to their playing position (Forwards and Backs) and playing level (Honor Division and Honor Division B); and 2) to compare the dietary intake with the dietary requirements and the correlation between the anthropometric characteristics and the dietary intake.
METHODS
Participants and study design
Fifty-three Rugby union players currently playing in a Spanish elite club (Age: 25.2 ± 5.07 yrs, range 18 – 36 yrs; Height: 1.82 ± 0.07 m; Weight: 92.8 ± 13.9 kg) volunteered in this study. Participants belong to two different teams; Honor Division (HD; n=28) and Honor Division B (HDB; n=25). Players were categorized into two position groups based on the international standard: HD (15 Forwards, 13 Backs) and HDB (13 Forwards, 12 Backs).
The protocol complied with the ethics of the local laws. All participants received a clear explanation of the study before signing the written consent. Those players who for some reason could not attend the scheduled data collection did not complete the 24-hour recall and/or declined to participate in this study were excluded.
Procedure
This is a descriptive observational study as a previous step of a future intervention (pre-post) study. All data were collected in a room closed to the playing field where players attended once in a specific date; four scheduled appointments were conducted in a day one hour before the training session. Research was conducted during the second half of the competitive period (Figure 1).
Players performed 2-hrs of training including field and strength training three days per week on average. Seventy-five percent of the HD and 80% of the HDB workout for 2-hrs in an individual training session in the gym twice a week.
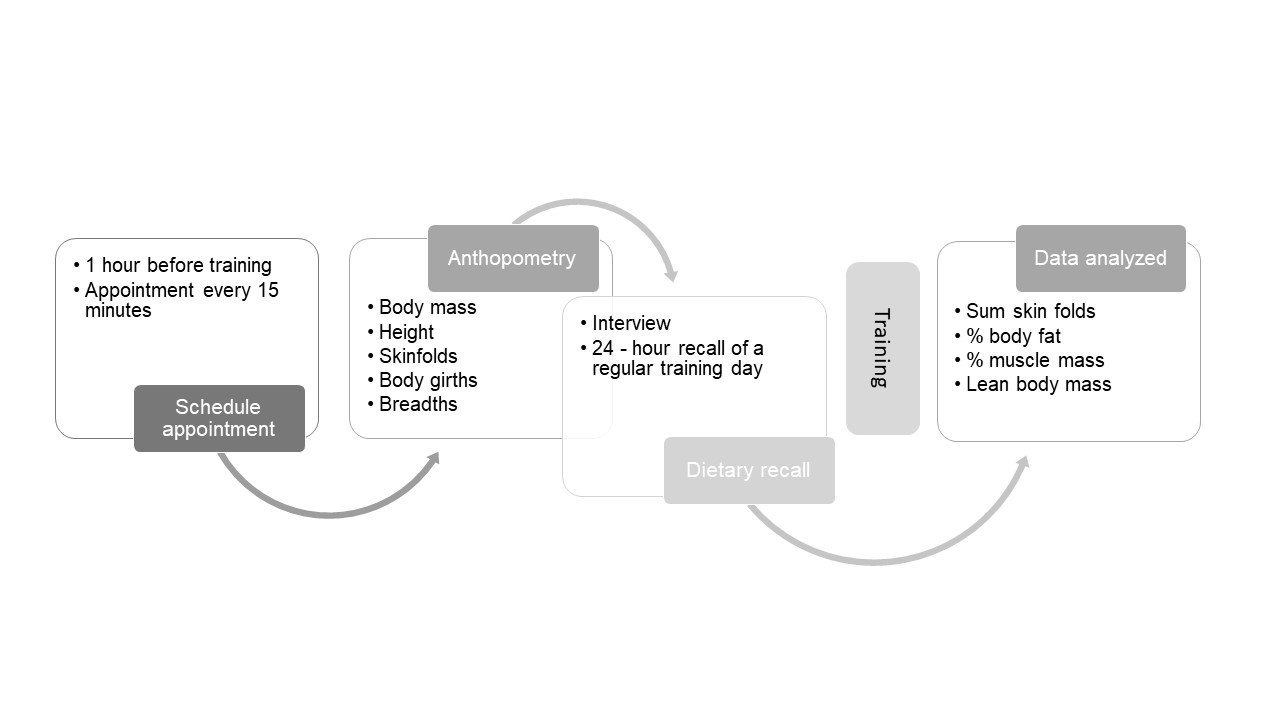
Figure 1. Procedure method diagram
Anthropometry
The athletes were weighted wearing only shorts using a calibrated digital scale (TANITA, Illinois USA) to the nearest 0.1 kg, and height was measured using a wall stadiometer (SECA, Birmingham UK). As an estimate of body fat, skinfold thickness was measured at eight sites (triceps, subscapular, biceps, iliac crest, supraespinale, abdominal, front thigh, medial calf) of the right side of the body using a calibrated skinfold caliper (Harpenden, West Sussex UK). The anthropometric measurements were in accordance with standard protocols of the International Society for Advancement of Kinanthropometry (ISAK, 2011) and were recorded by a level 1 accredited anthropometrist. Skinfold thicknesses were measured to the nearest 0.1 mm and the mean of 2 measurements was taken. Data were reported as the sum of 8 sites, although the body fat was calculated using the Faulkner equation. For skeletal muscle mass, the calculation used was the Lee equation since it is the recommended by the anthropometry working group (GREC) of the Spanish Federation of Sports Medicine (Alvero Cruz et al., 2009). Body girths were measured with a flexible steel tape (TAQ, Ciudad de México, MX) on the arm relaxed, arm flexed and tensed, wrist, waist, gluteal (hips), calf and mid-thigh, and the biepicondylar humerus breadths were also measured using a bone caliper (Futrex, USA).
Dietary recall
A 24-hour recall was used to assess energy consumption, and macronutrient composition of the dietary intake of the athletes by a nutritionist on the same appointment scheduled after measurements were taken (Castell et al., 2015). Players were interviewed and asked to recall their nutritional intake over a typical training day. Specific details were requested by the nutritionist to obtain the type of food and its characteristics: presentation (fresh, precooked, frozen), net quantity consumed, the method of preparation, commercial brands, and dressings. The macronutrient and energy intake was calculated using the Mexican System of Equivalent Food “Sistema Mexicano de Alimentos Equivalentes”(Pérez Lizaur, Palacios Gónzales, Castro Vecerra, & Flores Galicia, 2008). To asses energy expenditure we used the Cunningham equation to determine the resting metabolic rate (Tinsley, Graybeal, & Moore, 2018), to determine the calories used for training the metabolic equivalents (METs) for Rugby Union Team were used for each hour of training (Ainsworth et al., 2011).
Statistical analyses
Statistical tests were performed using the Statistical Package for the Social Sciences (SPSS Version 23.0.0 IBM SPSS Statistics for Windows, Chicago IL, USA). All data were initially checked for normality using a Kolmogorov-Smirnov and for equality of variance using a Levene´s test. Initially, all data was assessed for descriptive statistics expressing the data as average ± standard deviation (SD). Subsequently, differences between HD and HDB and between Forwards and Backs were analyzed using a two-way mixed design analysis of variance ANOVA (category x player position). If any significant F values were observed, a Tukey post hoc test was performed to determine significant differences between groups. An alpha value of p≤0.05 was set for all tests. Pearson correlation (r) analyses were conducted to determine linear relationships between the anthropometric characteristics and the dietary intake classifying the correlation values.
RESULTS
Table 1 presents the mean ± standard derivation (SD) of the anthropometric characteristics of the rugby players according to their position and player level.
Table 1 . Anthropometric characteristics
1, 2 = differences between Honor Division and Honor Division B (p<0.05)
F, B = differences between Forwards and Backs (p<0.05)
Values are mean ± SE.
Category might contribute on the anthropometrical characteristics on the rugby players, but that effect might differ across position. Players on the HD category showed a significant effect on age (F (1, 49) = 5.04, p <0.029), body mass (F(1, 49) = 10.74, p <0.002), kg of muscle mass (F(1, 49) = 16.2, p <0.001) and lean body mass, (F(1, 49) = 17.9, p <0.001). Concerning the position we found a significant effect on height (F(1, 49) = 11.7, p <0.001), body mass (F(1, 49) = 39.9, p <0.001), BMI (F(1, 49) = 20.6, p <0.001), sum of skinfolds (F(1, 49) = 8.28, p <0.006), body fat percentage (F(1, 49) = 11.2, p <0.002), muscle mass in kilograms (F(1, 49) = 6.80, p <0.012) and lean body mass (F(1, 49) = 39.3, p <0.001), since forwards had higher results and only found significant difference where backs has higher data in muscle mass percentage (F(1, 49) = 18.7, p <0.001). The interaction of shared category and playing position was significant for muscle mass in kilograms (F(1, 49) = 4.59, p <0.037) (Table 1).
Table 2 presents the mean ± standard derivation (SD) for dietary qualities of the diet that include total kcal, percentage of carbohydrates, proteins, and lipids, in addition carbohydrate and protein expressed in grams per kilogram of body mass obtained by the 24-hour recall for HD Forwards, HD Backs, HDB Forwards and HDB Backs.
Table 2. Dietary Intake, from the 24-hour recall
1, 2 = differences between Honor Division and Honor Division B (p<0.05)
F, B = differences between Forwards and Backs (p<0.05)
Values are mean ± SE.
The average estimated energy expenditure was 4879 ± 570 kcal∙day and measured dietary energy intake was 2647 ± 739 kcal∙day. Findings identified that players on the HD category had a significant effect on the total calories intake (F (1, 49) = 7.68, p <0.008) (Table 2).
Associations between anthropometric and dietary intake are presented in Table 3. Body mass showed a moderate correlation with carbohydrate (g/kg) and protein (g/kg) (r = -0.37, p = 0.006**; r = -0.29. p = 0.031*). BMI was small correlated to the lipids (%) consume in the diet (r = 0.27, p = 0.044*), moderate correlation with carbohydrate (g/kg) and protein (g/kg) (r = -0.46, p = 0.001**; r = -0.30, p = 0.026*). The sum of the skinfolds showed a moderate correlation with carbohydrate (g/kg) and protein (g/kg) and lipids (%) (r = -0.43, p = 0.001**; r = -0.44. p = 0.001**; r = 0.39, p = 0.003**). The body fat percentage wad moderate correlation with carbohydrate (g/kg) and protein (g/kg) and lipids (%)) (r = -0.48, p = 0.001**; r = -0.44. p = 0.001**; r = 0.40, p = 0.003**). Muscle mass percentage was moderate correlation with carbohydrate (g/kg) and protein (g/kg) and lipids (%) (r = 0.39, p = 0.004**; r = 0.35. p = 0.010*; r = -0.41, p = 0.002**). Lean body mass had a small correlation with de carbohydrate (g/kg) (r = -0.29, p = 0.037*).
Table 3. Significant associations (Pearson coefficient) between anthropometric and dietary intake
CHO: carbohydrates, P: proteins, L: lipids, BMI: body mass index, LBM: lean body mass
Associations between anthropometric and dietary intake for each category are presented in table 4. The HD category intake of carbohydrates (g/kg) showed a strong correlation with body mass (r = -0.48, p = 0.009**), BMI (r =,-0.64 p = 0**), sum of the skinfolds (r = -0.48, p = 0.009**), body fat percentage (r = -0.59, p = 0.001**) and a moderate correlation with lean body mass (r = -0.40, p = 0.034*). The HDB category intake of lipids (%) showed a moderate correlation with body mass (r = 0.45, p = 0.023*), sum of the skinfolds (r = 0.49, p = 0.011*), body fat percentage (r = 0.48 p = 0.014*) and with muscle mass (r = -0.44, p = 0.026*) and a strong correlation with BMI (r = 0.54, p = 0.006**). The protein (g/kg) intake showed a moderate correlation with body mass (r = -0.48, p = 0.015*), BMI (r = -0.48, p = 0.0015*), muscle mass (r = 0.40, p = 0.045*) and lean body mass (r = 0.41, p = 0.043*), while they showed a strong correlation with sum of the skinfolds (r = -0.53, p = 0.006**) and body fat percentage (r = -0.52, p = 0.007**).
Table 4. Significant associations (Pearson coefficient) between anthropometric and dietary intake by category
CHO: carbohydrates, P: proteins, L: lipids, BMI: Body Mass Index, LBM: lean body mass
DISCUSSION
Anthropometric characteristics differ extensively among Rugby players. The variability depends on the category of the team, the positional role and the intake and quality of the diet (Till, Tester, et al., 2017). This study was designed to compare the anthropometric characteristics of rugby players according to their playing level (HD and HDB) and their playing position (Backs and Forwards) and to compare the dietary intake to the dietary recommendation. The results of this study suggest that there are some differences in the anthropometric characteristics in between categories and in between playing position.
The players at HD tend to be older, had a greater body mass, skeletal muscle (kg) and lean body mass, this is due to normal adaptations related to maturation and development and it is consistent with previous research (Sedeaud et al., 2012; Till, Tester, et al., 2017). The development of lean body mass is essential to increase speed, strength and consequently power, the higher the category this will become of greater importance. (Sedeaud et al., 2012).
The most common comparison of the anthropometric characteristics of Rugby players is between the Forwards and the Backs given the specific tasks of each position, since Forwards spend significantly more time tackling and in contact phases than Backs (García et al., 2014; Sedeaud et al., 2012). Consistently with previous published works, the present study found that Forwards were taller, heavier, and had greater skinfold thickness than Backs (Da Cruz-Ferreira & Ribeiro, 2013; Gabbett, 2006; Morehen, Routledge, Twist, Morton, & Close, 2015; Till, Tester, et al., 2017). While greater skinfold thickness proposes to be a shielding role against the high number of high-speed physical collision received by Forwards (Gabbett, 2006), in contrast Backs have lower body mass and body fat and so they can maximize their acceleration and velocity capacity to be able to gain advantage in the unmarking, dribbling and ending of plays, as an advantage they can sustain continuous and prolonged efforts in the ball despite in static and dynamic phase (Da Cruz-Ferreira & Ribeiro, 2013). Optimum skinfold size and body fat percentage scores for each Rugby player is unknown, and it may be appropriate to individually control body fat levels, with four site skinfold recommended at approximately 30 mm in Backs and 40 mm in Forwards (Till, Tester, et al., 2017).
Although a greater skinfold could be a protective characteristic for collision for the forwards, this thickness also indicates a higher body fat, and this may also increase the aerobic demands required to maintain high-intensity activities during an 80 min match, and reduce the ability to dissipate heat during the activity (Gabbett, 2006), the acceleration and the metabolic efficiency (Jones et al., 2015). To consider the body fat as a predictive tool in Rugby players further investigations should be made, as it may be beneficial for collision but it could also have a negative in the performance, since intramuscular fatty infiltration has been identified as a contributor to declining strength and mobility, independently of muscle size (Robles et al., 2015).
A more considerable amount of lean mass could allow a higher amount of force production. Considering that Forwards are required to produce high amounts of force in the collisions (Jones et al., 2015), it makes sense that the study found a greater amount of lean body mass and skeletal muscle in Forwards than in Backs. Those results agree with findings from other studies in literature (Jones et al., 2015; La Monica et al., 2016; Morehen et al., 2015).
While the BMI (Body Mass Index) is not considered a valid indicator of body composition of athletes in high competition as a surrogated measure of adiposity (García et al., 2014), in our study, we consider it to estimate the greatness of the body mass. BMI on Forwards and Backs increased significantly in the Rugby World Cups between 1987 (29 and 25 kg*m2) and 2007 (31 and 27 kg*m2). This can be explained by increases in training load between those years (Sedeaud et al., 2012). Our findings for the HD category were similar to the ones described by García and collaborators (2014) with average BMI values of 30.6 and 26.9 kg*m2 for Forwards and Backwards of HD respectively, while for the HDB the BMI was lower with values of 28.4 and 24.4 kg*m2 for Forwards and Backwards.
Such findings again suggest that anthropometry cannot be used on its own for player selection and it should always be viewed alongside other key performance indicators (Morehen et al., 2016). Body mass is another crucial variable for Rugby players, and we suggest that it is better to have high values of body weight with a high lean mass instead of fat mass, because a high value of fat mass may be an extra load in locomotion and jumping. Given this information, the nutritional plan may play an essential role in the training of these players. In countries with a long Rugby tradition, body composition and diet are considered a fundamental part of subsequent success or failure in the sport (García et al., 2014). Meeting the optimal nutrition intake will be beneficial to fuel the training and competitions and to promote optimal recovery, and for general health.
The players in the present study failed to meet the current recommendations of an adequate diet. The analysis of the 24-hour recall revealed that the energy intakes in a typical training day were only 2647.53 ± 739.69 kcal in total. This data meet only 54.74% of the energy recommendations. For the HD team, the energy intake was 2809 ± 812 (57.1%) and 3008 ± 807 kcal (60.1%) for Forwards and Backs, respectively; and for the HDB team, the energy intake was 2471 ± 602 (51.3%) and 2247 ± 493 kcal (51.5%) for Forwards and Backs, respectively. This data is under the previously estimated for elite Rugby union players as were values of 3537 and 3179 kcal for Forwards and Backs, respectively (Ainsworth et al., 2011). It cannot be left out that the relatively low energy intake observed in the present study could be related to the fact that energy intake was assessed using a 24-hour recall. However, all players reported that the day described as a “typical”, so it is possible that the players in the present study may have intentionally or unintentionally underreported the total energy intake (Bradley, Cavanagh, Douglas, Donovan, Morton, et al., 2015) or they had avoided the snacks even when they were requested to include all the food and drink ingested in the considered 24 hours.
In future research, it would be also interesting to measure in a more objective way the energy intake of the Rugby players to ensure that the current dietary practices are adequate for physiological health. It would be also interesting to develop a prediction equation more suitable for athletes with high muscle mass (Bradley, Cavanagh, Douglas, Donovan, Morton, et al., 2015; Morehen et al., 2016).
Recent guidelines clearly state that CHO intake must meet the athletes training goals. Burke et al. (2011) stated values of 6 – 10 g/kg for athletes engaged in moderate to high-intensity exercise lasting 1 - 3 hours. Therefore, the participants of this study, as in previous studies, failed to meet the daily recommended CHO requirements (Bradley, Cavanagh, Douglas, Donovan, Morton, et al., 2015; MacKenzie, Slater, King, & Byrne, 2015), we can observed a higher intake for the HD consuming (3.28 ±1.12g/kg) for Backs and (2.47 ±1.3g/kg) for Forwards, while the participants of the HDB had a lower intake of CHO for Backs (2.77 ± 1.08g/kg) and Forwards (2.49 ±0.89 g/kg). However, since Rugby players have a vast amount of body mass and the recommendations are given in grams per kilogram of body mass, this recommendation may be too high for Rugby players (Bradley, Cavanagh, Douglas, Donovan, Morton, et al., 2015).
The protein consumption data in the present study suggest an over-consumption of 2.04 ± 0.77 g/kg for both teams, while we can observe the higher intake for the Backs in the HD (2.39 ± 1.03 g/kg) and the lowest intake of protein for the Forwards in HDB (1.83 ± 0.80 g/kg). The observed results are considerably higher than the guidelines for strength dedicated athletes (1.5 – 1.7 g/kg) and also for endurance dedicated athletes (1.2 – 1.6 g/kg) (Burke, 2010). However, previous studies have also seen similar protein consumption up to 2.7 g/kg (Bradley, Cavanagh, Douglas, Donovan, Twist, et al., 2015; MacKenzie et al., 2015). Nevertheless, this amount of protein may be beneficial to stimulate muscle protein synthesis or to maintain the amount of muscle mass for the Rugby players (Bradley, Cavanagh, Douglas, Donovan, Morton, et al., 2015; MacKenzie et al., 2015), since we found a positive correlation between the protein intake and the muscle mass and a negative correlation with the body fat percentage.
Carbohydrates may be also beneficial for the muscle growth and maintaining the body fat percentage lower, since we also found a correlation in the HD with intake of carbohydrates and body composition, given that, they had higher intake than the HDB and the BMI and lean body mass were greater, and the body fat was lower.
Finally, future research should be carried out on a larger sample in an attempt to establish an anthropometric profile for the different position groups and categories of RU. We recommend performing more than a 24-hour recall to increase the accuracy of the data.
In conclusion, this study report that there were significant differences by category for age, body mass and muscle mass, suggesting that these changes are due to maturation, body size and the number of training hours for HD. Considering the position of the player, Forwards tended to be taller, heavier and to have more copious amounts of muscle mass and body fat, probably due to the physiological demands of the game. Regarding the dietary intake, we report that energy protein and carbohydrates intake did not reach the dietary recommendations, suggesting that the 24-hour recall could underestimate the intake and also that the current recommendations overestimate the kcal intake, due to the high values of the body mass. These findings may provide reference data for Rugby union players by playing team and category.
Referencias
1. Ainsworth, B. E., Haskell, W. L., Herrmann, S. D., Meckes, N., Bassett JR, D. R., Tudor-Locke, C., … Leaon, A. L. (2011). 2011 Compendium of Physical Activities: A Second Update of codes and Met Values. Sports Exerc, 43(6), 1002–1009. https:// doi.org/10.1249/MSS.ObO
2. Alvero Cruz, J., Cabañas Armesilla, M. D., Herrero de Lucas, A., Martinez Riaza, L., Moreno Pascual, C., Porta Manzañido, J., … Sirven Belando, J. E. (2009). Protocolo de valoración de la composición corporal para el reconocimiento médico-deportivo. Documento de Consenso del Grupo Español de Cineantropometría de la Federacion Española de Medicina del Deporte. Archivos de Medicina Del Deporte, 26(Cc), 166–179.
3. Bradley, W. J., Cavanagh, B., Douglas, W., Donovan, T. F., Morton, J. P., & Close, G. L. (2015). Quantification of Training Load, Energ Intake, And Pgysiological Adaptations During a Rugby Preseason: A Case Study Form an Elite European Rugby Union Squad. The Journal of Strenght & Conditioning Reaserch, 29(2), 534–544.
4. Bradley, W. J., Cavanagh, B., Douglas, W., Donovan, T. F., Twist, C., Morton, J. P., & Close, G. L. (2015). Energy intake and expenditure assessed ‘in-season’ in an elite European rugby union squad. European Journal of Sport Science, 15(6), 469–479. https:// doi.org/10.1080/17461391.2015.1042528
5. Burke, L. M. (2010). Nutrición en el deporte, Un enfoque práctioo (1st ed. ). Madrid: Editorial Médica Panamericana S.A.
6. Burke, L. M., Hawley, J. A., Wong, S. H. S., & Jeukendrup, A. E. (2011). Carbohydrates for training and competition. Journal of Sports Sciences, 29(SUPPL. 1). https:// doi.org/10.1080/02640414.2011.585473
7. Carling, C. J., Lacome, M., Flanagan, E., O’Doherty, P., & Piscione, J. (2017). Exposure time, running and skill-related performance in international u20 rugby union players during an intensified tournament. PLoS ONE, 12(11), 1–15. https:// doi.org/10.1371/journal.pone.0186874
8. Castell, G. S., Serra-Majem, L., & Ribas-Barba, L. (2015). What and how much do we eat? 24-hour dietary recall method. Nutricion Hospitalaria, 31, 46–48. https:// doi.org/10.3305/nh.2015.31.sup3.8750
9. Cunningham, D., Shearer, D. A., Drawer, S., Eager, R., Taylor, N., Cook, C., & Kilduff, L. P. (2016). Movement demands of elite U20 international rugby union players. PLoS ONE, 11(4), 4–6. https:// doi.org/10.1371/journal.pone.0153275
10. Da Cruz-Ferreira, A. M., & Ribeiro, C. A. F. (2013). Anthropometric and physiological profile of portuguese rugby players - Part I: Comparison between athletes of differend position groups. Revista Brasileira de Medicina Do Esporte, 19(1), 52–55. https:// doi.org/10.1590/S1517-86922013000100011
11. Duthie, G. M., Pyne, D. B., Hopkins, W. G., Livingstone, S., & Hooper, S. L. (2006). Anthropometry profiles of elite rugby players: Quantifying changes in lean mass. British Journal of Sports Medicine, 40(3), 202–207. https:// doi.org/10.1136/bjsm.2005.019695
12. Gabbett, T. J. (2006). A comparison of physiological and anthropometric characteristics among playing positions in sub-elite rugby league players. Journal of Sports Sciences, 24(12), 1273–1280. https:// doi.org/10.1080/02640410500497675
13. Gamazo, T. (2014). A comparison of anthropometric and maximal strength measures in rugby union players. University of Central Florida.
14. García, M., Martínez-Moreno, J. M., Reyes-Ortiz, A., Suarez Moreno-Arrones, L., García, A., & Garcíacaballero, M. (2014). Changes in body composition of high competition rugby players during the phases of a regular season; influence of diet and exercise load. Nutricion Hospitalaria, 29(4), 913–921. https:// doi.org/10.3305/nh.2014.29.4.7227
15. Heffernan, S. M., Kilduff, L. P., Erskine, R. M., Day, S. H., McPhee, J. S., McMahon, G. E., … Williams, A. G. (2016). Association of ACTN3 R577X but not ACE I/D gene variants with elite rugby union player status and playing position. Physiological Genomics, 48(3), 196–201. https:// doi.org/10.1152/physiolgenomics.00107.2015
16. ISAK. (2011). International standards for anthropometric assessment. Lower Hutt, New Zealand: International Society for the Advancement of Kinanthropometry. https:// doi.org/10.1152/japplphysiol.00187.2013
17. Jones, B., Till, K., Barlow, M., Lees, M., O’Hara, J. P., & Hind, K. (2015). Anthropometric and three-compartment body composition differences between super league and championship rugby league players: Considerations for the 2015 season and beyond. PLoS ONE, 10(7), 1–11. https:// doi.org/10.1371/journal.pone.0133188
18. La Monica, M. B., Fukuda, D. H., Miramonti, A. A., Beyer, K. S., Hoffman, M. W., Boone, C. H., … Hoffman, J. R. (2016). Physical differences between forwards and backs in American collegiate rugby players. Journal of Strength and Conditioning Research (Vol. 30). https:// doi.org/10.1519/JSC.0000000000001388
19. MacKenzie-Shalders, K. L., Byrne, N. M., Slater, G. J., & King, N. A. (2015). The effect of a whey protein supplement dose on satiety and food intake in resistance training athletes. Appetite, 92, 178–184. https:// doi.org/10.1016/j.appet.2015.05.007
20. MacKenzie-Shalders, K. L., King, N. A., Byrne, N. M., & Slater, G. J. (2016). Increasing protein distribution has no effect on changes in lean mass during a rugby preseason. International Journal of Sport Nutrition and Exercise Metabolism, 26(1), 1–7. https:// doi.org/10.1123/ijsnem.2015-0040
21. MacKenzie, K., Slater, G., King, N., & Byrne, N. (2015). The measurement and interpretation of dietary protein distribution during a rugby preseason. International Journal of Sport Nutrition and Exercise Metabolism, 25(4), 353–358. https:// doi.org/10.1123/ijsnem.2014-0168
22. Morehen, J. C., Bradley, W. J., Clarke, J., Twist, C., Catherine, H., R, S. J., … Close, G. L. (2016). The Assessment of Total Energy Expenditure During a 14-day “In-season” Period of Professional Rugby League Players Usinf the Doubly Labelled Water Merhod. International Journal of Sport Nutrition and Exercise Metabolism, 26(5), 464–472. https:// doi.org/10.1123/ijspp.2015-0012
23. Morehen, J. C., Routledge, H. E., Twist, C., Morton, J. P., & Close, G. L. (2015). Position specific differences in the anthropometric characteristics of elite European super league rugby players. European Journal of Sport Science, 15(6), 523–529. https:// doi.org/10.1080/17461391.2014.997802
24. Nakamura, F. Y., Pereira, L. A., Moraes, J. E., & Kobal, R. (2017). Physical and physiological differences of backs and forwards from the Brazilian National rugby union team. Journal of Sports Medicine and Physical Fitness, 57(12), 1549–1556. https:// doi.org/10.23736/S0022-4707.16.06751-7
25. Pérez Lizaur, A. B., Palacios Gónzales, B., Castro Vecerra, A. L., & Flores Galicia, I. (2008). Sistema mexicano de alimentos equivalentes (4th ed. ). Mexico City: Ogali.
26. Roberts, S. P., Stokes, K. A., Trewartha, G., Hogben, P., Doyle, J., & Thompson, D. (2011). Effect of combined carbohydrate-protein ingestion on markers of recovery after simulated rugby union match-play. Journal of Sports Sciences, 29(12), 1253–1262. https:// doi.org/10.1080/02640414.2011.587194
27. Robles, P. G., Sussman, M. S., Naraghi, A., Brooks, D., Goldstein, R. S., White, L. M., & Mathur, S. (2015). Intramuscular fat infiltration contributes to impaired muscle function in COPD. Medicine and Science in Sports and Exercise, 47(7), 1334–1341. https:// doi.org/10.1249/MSS.0000000000000556
28. Sawaya, A., Tucker, K., Tsay, R., Willett, W., Saltzman, E., GE, D., & SB, R. (1996). Evaluation of four methods for determining energy intake in young and older women: comparison with doubly labeled water measurements of total energy expenditure. American Journal of Clinical Nutrition, 63(4), 491–499 9p. Retrieved from http://search.ebscohost.com/login.aspx?direct=true&db=rzh&AN=107384379&site=ehost-live
29. Sedeaud, A., Marc, A., Schipman, J., Tafflet, M., Hager, J.-P., & Toussaint, J.-F. (2012). How they won Rugby World Cup through height, mass and collective experience. British Journal of Sports Medicine, 46(8), 580–584. https:// doi.org/10.1136/bjsports-2011-090506
30. Suarez Moreno-Arrones, L., Portillo, L. J., & J.M., G.-M. (2014). Diferencias en el análisis de movimiento e intensidad de una final de rugby 7´s de alto nicel. Revista Andaluza de Medicina Del Deporte, 6(1), 30–37.
31. Till, K., Scantlebury, S., & Jones, B. (2017). Anthropometric and Physical Qualities of Elite Male Youth Rugby League Players. Sports Medicine, 47(11), 2171–2186. https:// doi.org/10.1007/s40279-017-0745-8
32. Till, K., Tester, E., Jones, B., Emmonds, S., Fahey, J., & Cooke, C. (2017). Anthopometric and Physical Characteristics of English Academy Rugby League Players. Sports Medicine, 47(11), 2171–2186.
33. Tinsley, G. M., Graybeal, A. J., & Moore, M. L. (2018). Resting metabolic rate in muscular physique athletes: validity of existing methods and development of new prediction equations. Applied Physiology, Nutrition and Metabolism, (806).
34. Zanetti, S., Pumpa, K. L., W, W. J., & Pyner, D. B. (2014). Validity of The SenseWear Armband to Assess Energy Expenditure During Intermittent Exercise and Recovery in Rugby Union Players. Journal of Strength and Conditioning Research, 28(4), 1090–1095.